|
|
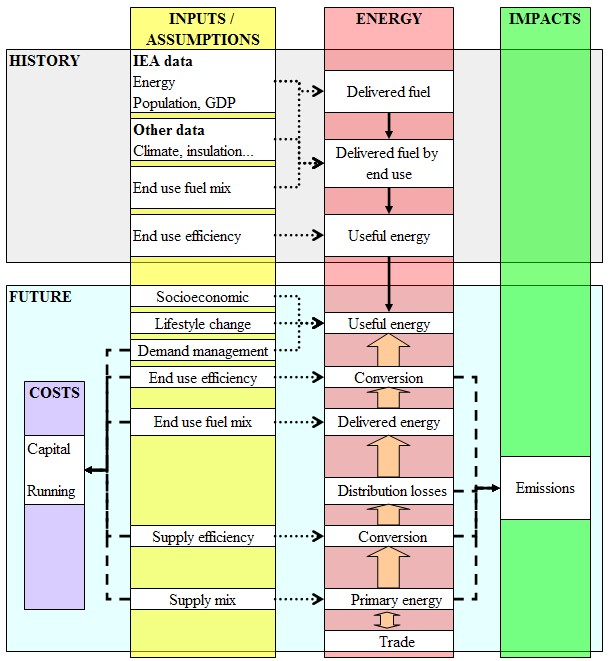
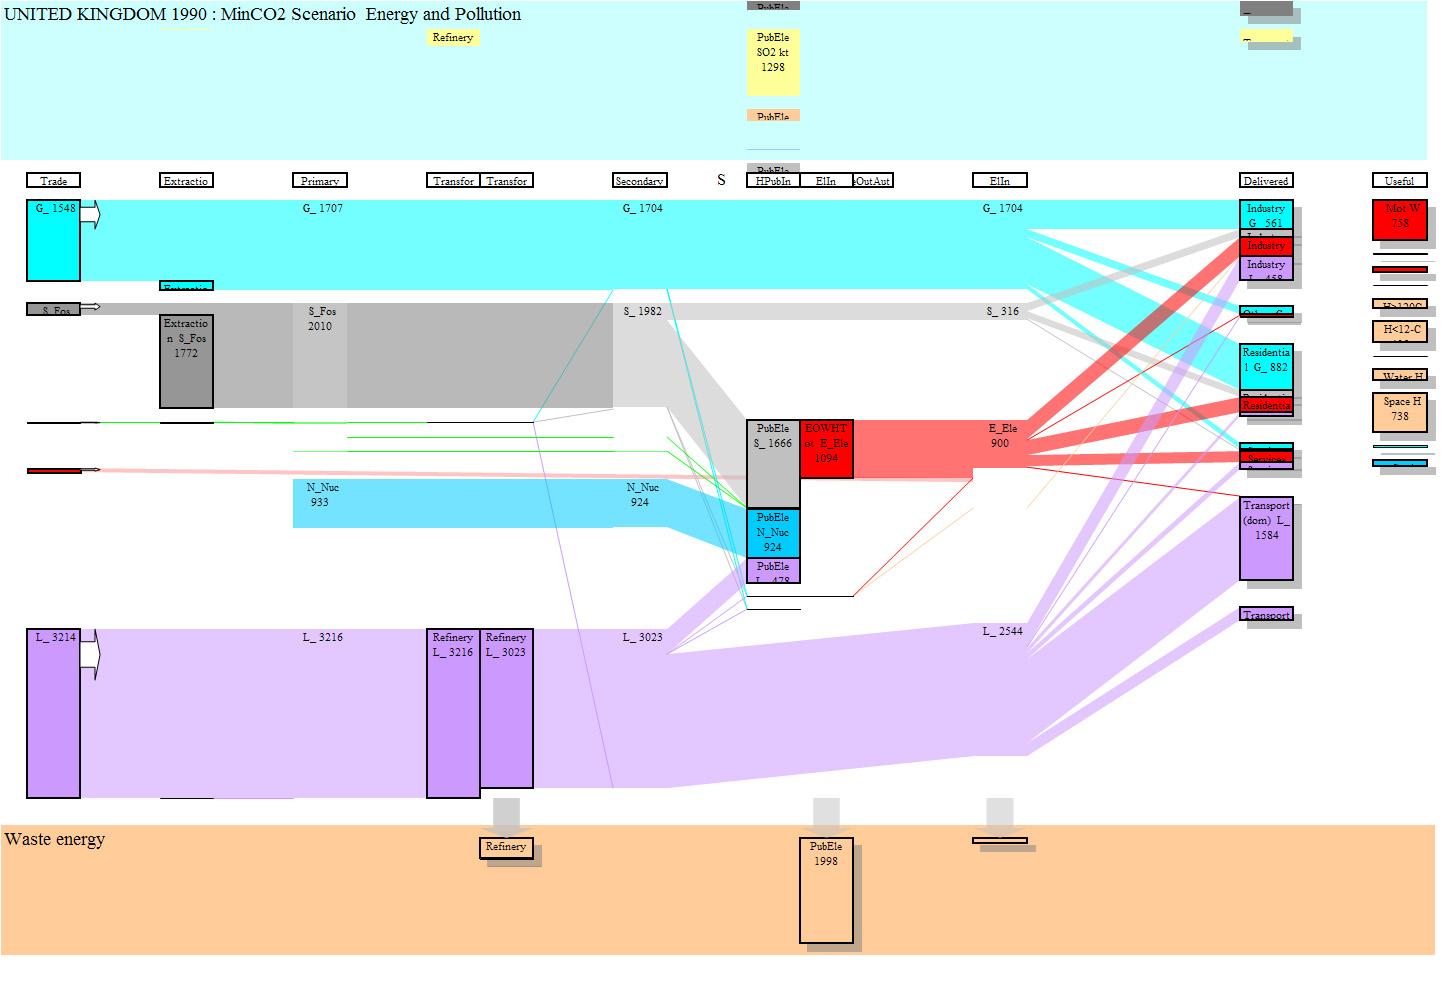
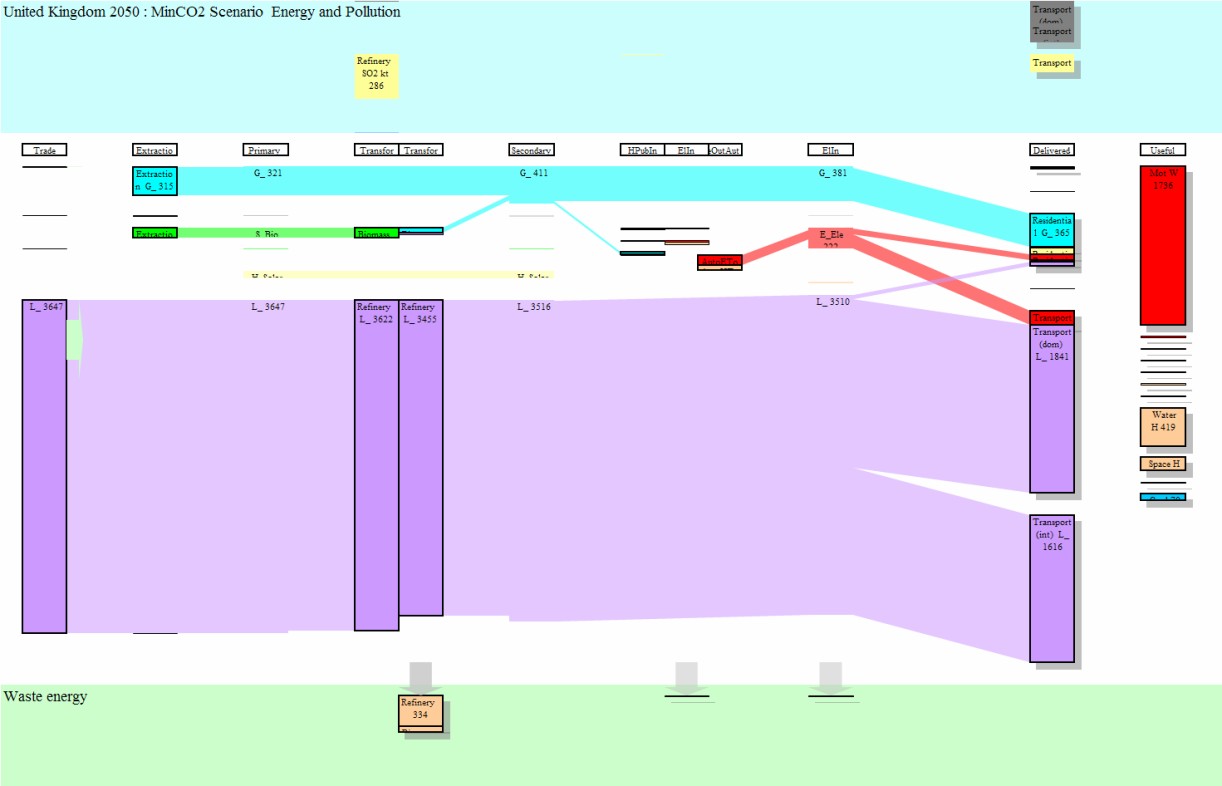
Society, Energy and Environment Scenario model - SEEScenSENCO 's model of a society's energy demand and supply system, and its associated environmental impacts, is called SEEScen. It can be used to rapidly explore scenarios for many countries. An example of the application of a previous version of the model (called ScenaGen) may be downloaded at Alternative Energy Scenario for the European Union. Scenarios for the UK, using SEEScen and other models are under development here. A video of a Sankey diagram of the UK (see below) illustrating changes to energy flows over 60 years for one scenario can be downloaded here (2.6 Mb, wmv) or here (0.6 Mb, gif). Play this as a video, or pull the slider across to see the diagram for different years. SEEScen incorporates 11 energy end uses (motive power, lighting, heating etc.) across 15 sectors. Some of these end uses have physical models; for example, domestic space heating and cooling are estimated with a model of a house which allows the effects of parameters such as insulation and internal temperatures to be examined. These end uses are then allocated to end use energy conversion devices (e.g. boilers) and fuels (e.g. solar) and delivered fuel requirements calculated. Delivered fuels are allocated to secondary fuels (e.g. electricity or gas) and primary energy inputs calculated after conversion (e.g. in a power station or refinery). Primary consumption is met by a mix of indigenous production and imports. Atmospheric emissions from energy conversions are calculated. The costs of all technologies (demand management as well as supply) and fuels and operational costs calculated to give a total cost of energy services. A database of energy technologies has been compiled. This includes energy conversion and storage technologies and demand management technologies. A fuels database contains data on the physical characteristics of fuels, and price assumptions. The main historical data inputs to SEEScen are annually updated energy and socioeconomic data from the OECD for all major countries of the world, and the model can therefore be rapidly applied to these. SEEScen can be used to generate scenarios over years (its main use to date), to simulate hourly flows, or, under development, to optimise by minimising cost for a year. Scenarios are constructed by making assumptions about: - Socioeconomic changes in terms of population, household size, wealth, industrial production and mix. Generally these are assumed constant across all scenarios. - Demand patterns - Levels of management, efficiency, energy mix and fuel prices - Emission control in energy technologies SEEScen has been used to study low carbon scenarios for the European Union incorporating fuel switching and energy efficiency. These scenarios have been input into other programmes which calculate the costs of meeting other targets including acid emission ceilings. The structure of SEEScen is shown below. SEEScen can generate energy flow charts, called Sankey diagrams. Sankey diagrams for the United Kingdom (1990) and (2050) are shown. These demonstrate the shift from coal and nuclear to other fuels, and the increasing fraction of energy that goes to transport. This is because of growth in transport, particularly aviation, and because it is easier technical to reduce energy demand in the stationary sector, and provide alternative fuels.
|
|
Send mail to
MarkBarrett@sencouk.co.uk with
questions or comments about this web site.
|